Manpower Summary Report
Overview
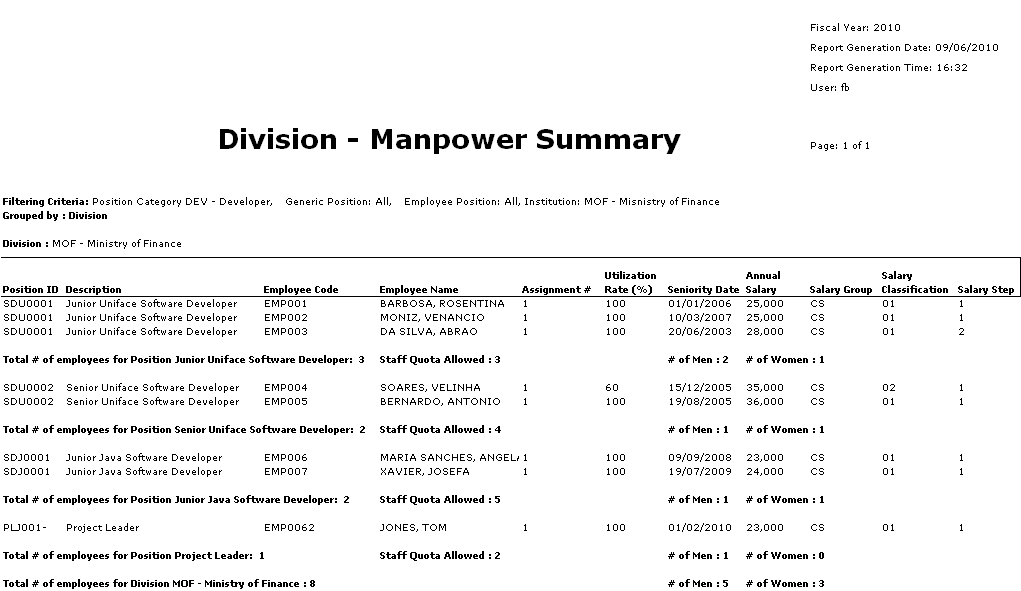
The Manpower summary report allows the user to see a breakdown of Employee Position, the staff quota allowed per position and the number of men and women for each institution. The user will have the ability to select multiple institutions to report on.
An example of the report is shown below.

Navigation 
Definition of Report Fields
The Manpower Summary Report includes the following fields:
| Report Fields | Description |
| Fiscal Year | 12 month period used for accounting purposes (differs from calendar year). |
| Report Generation Date | Date of report generation automatically generated by the system. |
| Report Generation Time | Time of report generation automatically generated by the system. |
| User | User who generates the report. |
| Filtering Criteria | Filter Criteria as entered under the Manpower Summary Report. |
| Grouped by: | Grouped by Unit or Division. |
| Position ID | Unique String Code that identifies the Position. |
| Description | Employee Position Title. |
| Employee Code | The employee who has this assignment. |
| Employee Name | Employee last and first name. |
| Assignment # | System generated integer. |
| Utilization Rate % | Percentage of effort for the assignment. Values should be between 1 and 100. If an employee has 2 active assignments then the utilization should not surpass 100% between the two. |
| Seniority Date | This is date is the official date that seniority takes in effect. |
| Annual Salary | Annual salary of employee. |
| Salary Group | Unique identifier identifying the group. |
| Salary Classification | Level of salary identified by a unique integer and is determine by the combination of group-subgroup-level. |
| Salary Step | An integer that is unique to a particular group-subgroup and level that is to be used for salary increases. |
| Staff Quota Allowed | Amount of staff permitted. |
| Number of Men | Number of employees with the same employee position where there gender is MALE. |
| Number of Women | Number of employees with the same employee position where there gender is FEMALE. |
| Total # of employees for Position Junior Uniface Software Developer for MOF - Unit1 | Total Number of employees with the same employee position. |
| Total # of employees for MOF | Number of employees within the grouping selected. |
Generation of the Report
The Manpower Summary Report allows the user to see a breakdown of Employee Position, the staff quota allowed per position and the number of men and women for each institution.
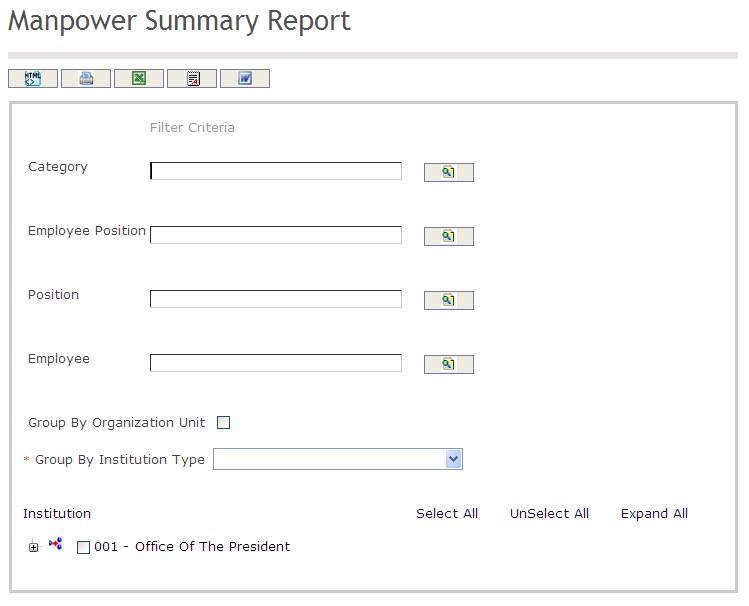
To GENERATE the Manpower Summary Report, follow the steps below:
Navigation 

The Manpower Summary Report includes the following filter criteria available for the report:
- Category - Category unit (optional parameter) that can be selected using the Lookup icon
 , and Find icon
  to retrieve the Category unit. If selected, the report will include the selected Category unit and all Categories below the selected unit
 - Employee Position - Employee Position unit (optional parameter) that can be selected using the Lookup icon
 , and Find icon
  to retrieve the Employee Position unit. If selected, the report will include the selected Employee Position unit and all Employee Positions below the selected unit
 - Position - Position unit (optional parameter) that can be selected using the Lookup icon
 , and Find icon
  to retrieve the Position unit. If selected, the report will include the selected Position unit and all Positions below the selected unit
 - Employee - Employee unit (optional parameter) that can be selected using the Lookup icon
 , and Find icon
  to retrieve the Employee unit. If selected, the report will include the selected Employee unit and all Employees below the selected unit
 - Group By Organization Unit - Click the Group By Organization Unit checkbox to enable this function
- Group By Institution Type - Select a Group By Institution Type from the drop-down menu
If all filter criteria are left blank, all Categories, Employee Positions, Positions, Employees, and Group By Institution Types will be included in the Report, as well as the Categories, Employee Positions, Positions, and Employees allowed by the report user security profile.
The report can be exported in HTML, PDF, MS Excel, RTF and MS Word formats, prior to printing, using the ![]() ,
,  ,
,  ,
,  , and
, and  icons.